TOP 61 Google Analytics Interview Questions and Answers: Ultimate Guide
If you are a blogger, Google works like a heart for you. If you are going for a Google Analytics job interview, it is important to understand Google’s approach. These are the top 61 interview questions and answers for Google Analytics. This guide will help you understand what questions your interviewer should ask.
Table of Contents
Togglegoogle analytics interview questions is a complete guide, and I am confident that you will not be disappointed after reading it. This guide is based on interviews and discussions with a variety of people. So, get ready for your interview, and let’s get started:
1. Explain Google Analytics in Simple Terms?
It is a web analytics tool developed by Google that gathers and analyzes data linked to website traffic. It helps in the optimization of a website and also improves the user experience.
The main objective of Google Analytics is to assist you in making decisions to increase the site’s productivity and profit.
With the help of a tracking code, Google Analytics can keep track of many things that people do when they visit your site, like how long they stay on your site, how many times they buy something, and their age, gender, and interests.
You May also Like:- Top 49 Social Media Marketing Interview Questions and Answers: Ultimate Guide
2. Tell us the Advantages of Google Analytics?
Advantages of Google Analytics are:-
- Analyzing consumer behavior
- Examine what works best for you.
- It helps you in determining where your visitors are coming from.
- Boost your conversion rate
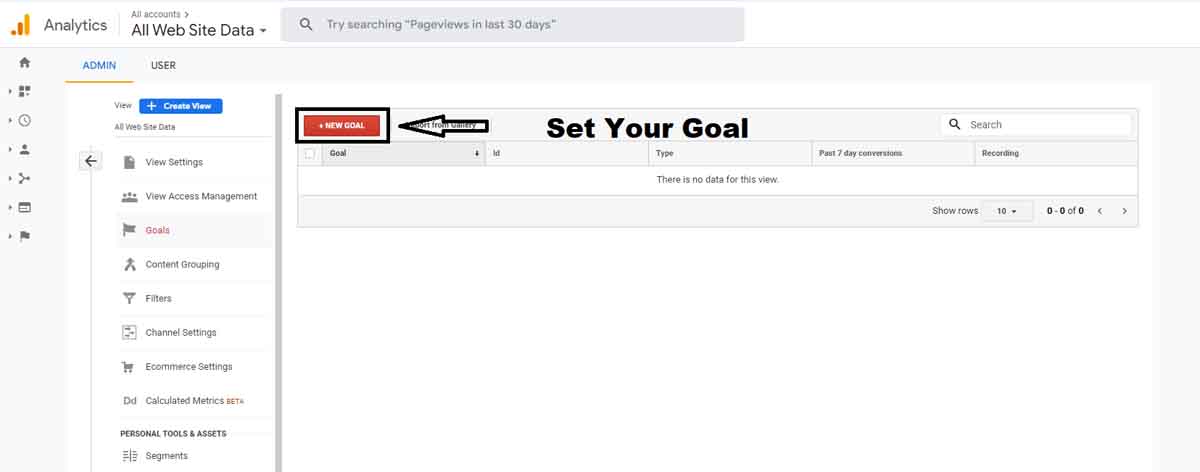
3. Define Google Analytics Goals?
In this, a goal allows you to measure user-interactions on your website. You may choose specific interactions to track, such as visits to the thank you page after a purchase, form submissions, ebook downloads, etc.
It allows you to assess how effectively your website converts and achieves your goals.
Each web property can include up to 20 goals.
There are 4 types of goals in Google Analytics –
- Destination goals
- Duration goals
- Event goals
- Pages or screen per session
You May also Like:- Top 67 Digital Marketing Interview Questions and Answers
4. What is KPI in Google Analytics?
KPIs are used to track all of the key performance indicators in the industry, like:-
- Total Visitors
- Exit Rate
- Total clicks
- Sessions
- Bounce Rate
- Unique Visitors
- Returning Visitors
- Pageviews
- Conversion Rate
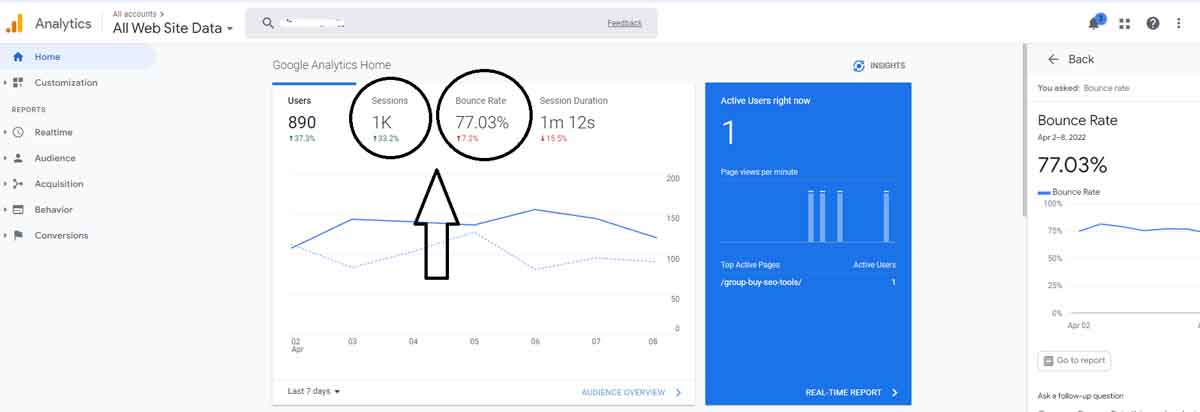
5. What is a Session?
A session is the number of actions a user has with the website during a given period. It is set to last 30 minutes but may be changed.
Visit pages, download e-books, buy things, and so on are examples of activities. Non-active users will not affect data after the session expires.
You May also Like:- What is Hyperlocal? A Game Changer Business Model
6. Explain Funnel in Google Analytics?
A funnel is a sequence of online pages, similar to a navigation route that your visitors must follow to achieve the website’s goals. It consists of one objective, which is a webpage, and one or more funnel pages.
Google Analytics has a maximum of 20 funnel pages. It assists in determining where users begin and finish their purchasing journey. Based on this, one may remove the obstacles in the conversion process.
7. Define Bounce Rate?
Bounce Rate is the percentage of website visitors that Exit the landing page without visiting any other pages or taking any specified action. It is the percentage of all sessions on your site. Users viewed only a single page and generated a single request to the analytics server, divided by the number of single-page sessions.
8. How to Track Conversions by Google Analytics?
Conversion is a completed user activity that is relevant to your business.
Conversions may be tracked using Google Analytics goals. Any specified objective, such as form submission, purchase, and high level of engagement, may track.
It is critical to configure goal tracking in Google Analytics correctly. Conversion path data from Google is also needed to monitor conversion. It shows how a user converted rather than just the point he converted.
You May also Like:- Top 15 Content Marketing Interview Questions and Answers (Must Read)
9. Explain Acquisition report in Google Analytics?
Google Analytics acquisition reports assess and record how users enter your website. Several reports are available to evaluate everything from the traffic source, i.e., where the user landed on your site.
It might be done directly via a search engine, social networking site, or other means. It also assesses how successful a particular ad campaign drew consumers and generated leads.
10. Difference Between Clicks and Visits?
Clicks describe activity on a website, such as clicking on a link, navigating to a new webpage, downloading a brochure, etc. A visit is the amount of time a person spends on a website.
11. Explain Exit Rate?
The percentage of site exits that happened from a webpage or set of pages is the Exit Percentage. It is the page on your website from which the visitor exited.
The exit rate is calculated as a percentage by dividing the total number of exits by the number of page views. Thank-you pages and blogs typically have a higher exit rate.
You May also Like:- 11 Best Email Marketing Books in 2023: You Need to Read
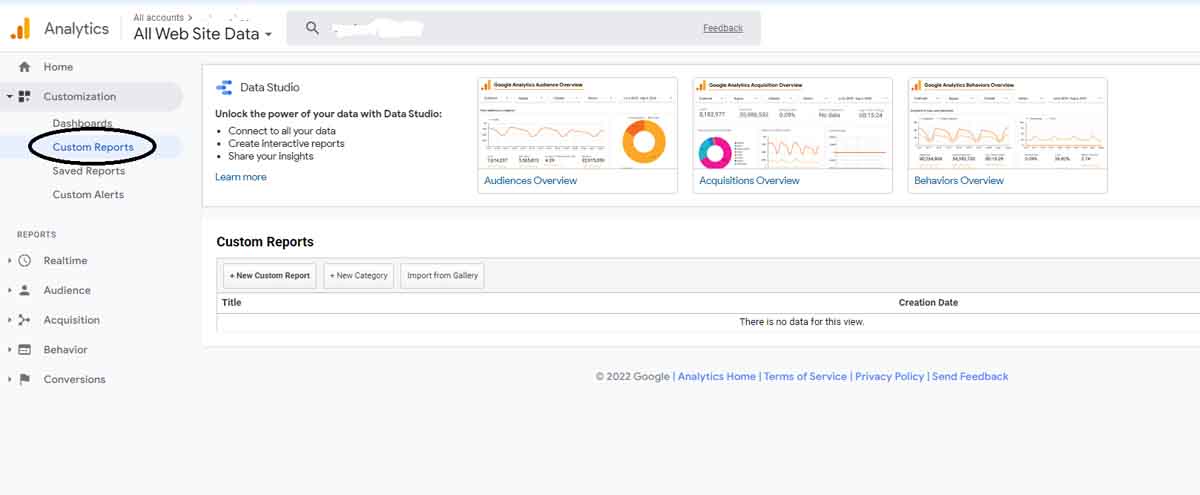
12. Tell us the Types of Custom Reports in Google Analytics?
There are three types of custom reports:
Explorer: A standard Google analytics report includes a line graph and a data table with dynamic components such as search, sort, and secondary dimensions.
Flat: A static, sortable table that shows data in rows is known as a flat table.
Map overlay: a map of the world with different areas and nations highlighted in deeper colours to reflect the level of traffic and interaction.
13. What are the top channels Google Analytics uses to track your traffic sources?
The following are the top traffic channels as reported by Google Analytics:-
Organic: People visit your website after clicking on a search engine organic link.
Direct: People who type your website’s domain into their browser’s URL bar and then visit your site.
Paid: People who click on PPC advertisements in SERPs are classified as paid.
Referrals are visitors that arrive at your site from other websites, such as Quora.com, Reddit.com, etc.
People that visit your site via Facebook, Twitter, or Instagram are referred to as “social channels.”
14. How do I find a popular page of my Website in Google Analytics?
To find the top pages on your website, go to Google Analytics’ behavior area.
You May also Like:- Top 10 network marketing companies in India
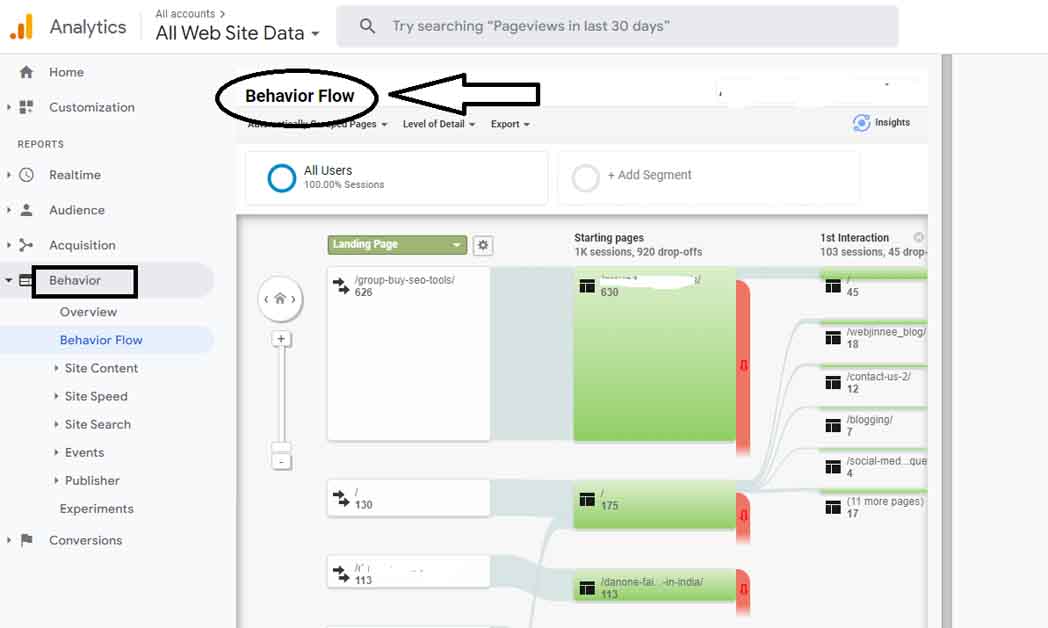
15. Explain Behavior in Google Analytics?
The total amount of total traffic is shown in the behavior report. The behavior flow report shows the path people follow on your website, from your website’s first landing page to the last page they viewed.
16. What are the Dimensions & Metrics in Google Analytics?
Dimensions are a feature or attribute of your data. It is a qualitative variable rather than a quantitative one. For example, Device, Campaign, City, Page, Goals, and Source.
Metrics are the numerical values found in dimensions. Metrics provide a numerical representation of what a user performed. It is a numerical measurement. Otherwise, it’s just numbers if there are no dimensions.
17. What is the site search button used for?
The website’s site search button allows users to search within the website.
18. What is Event Tracking?
User interactions with content that may be recorded separately from a web page or a screen load are known as events. e.g., Downloads, mobile ad clicks, gadgets, Flash elements, AJAX embedded elements, and video plays
You May also Like:- Top 10 Digital Marketing Trends
19. Explain the Elements of Event Tracking?
There are 3 Elements of Event Tracking in Google Analytics:-
- Category
- Action
- Label
20. Tell us, Ways to Increase-ecommerce Sales by Google Analytics?
Best Ways to Increase E-commerce Sales:-
- Look for keywords that will help you boost conversions.
- Tracking data with custom URLs
- Make a list of the top referral sources and actively pursue them.
- Identifying pages that result in conversions
- conversion Funnels
21. Can you access the personal information of visitors by using Google Analytics?
No, Not at all. Don’t even Try to do it because you can’t access the personal information of visitors by using Google Analytics?
You May also Like:- How to Create a Custom Facebook Business Page URL
22. How to find where visitors are clicking most?
Click on the option of In-Page Analytics; you can identify which areas of your website receive the most clicks. In-page analytics is a Google Chrome extension that lets you see click data right on the page.
23. Explain How cookies Work in GA?
When visitors visit a website, text files called cookies are stored on their browsers. When it comes to ga.js, it is critical to note that cookies are browser-specific.

24. Can you set up tracking for mobile phones?
You can use Google’s phone call conversion tracking option to track phone calls from mobile numbers on your website. It can help you figure out how well your ads work to get people to call from your website.
You May also Like:- 29+ Group buy SEO Tools in India (Just Rs. 149/-*)
25. Explain site speed in Google Analytics?
Reports on site speed show how quickly your website loads and is ready to connect with visitors. It helps you identify areas that need to be improved.
Google recommends a site speed of fewer than 3 seconds. Site speed is measured in three ways:-
- Loading time for a page
- load time of a single-user interaction such as an event, hit, etc.
- How quickly the browser scans and prepares the document for the user
26. What is Benchmarking?
In Google Analytics, benchmarking is a convenient tool. It analyses the performance of your website against previous performance as well as the industry average. It is beneficial because it gives you information about industry trends and lets you compare yourself to other businesses in your field.
For the following metrics, you can compare your data to benchmarks:-
- Sessions
- Percentage of New Sessions
- Pages versus Sessions
- average session length.
- Bounce Rate
You May also Like:- 249 Free Blog Submission Sites list (High DA-PA)
27. How can you find the UA tracking code?
UA stands for Universal Analytics. The Universal Analytics tracking code can be accessed in the web property’s admin section.
28. Can you Delete Goals in Google Analytics?
No, we can’t. We can stop the goal from being recorded by deactivating it.
29. What do you understand by Average Load Time?
The average amount of time it takes for the web page to load in the browser.
30. Can You change the session time in Google analytics?
Yes, by clicking on the session settings link in the admin section, we can modify the session duration from 30 minutes to whatever we want.
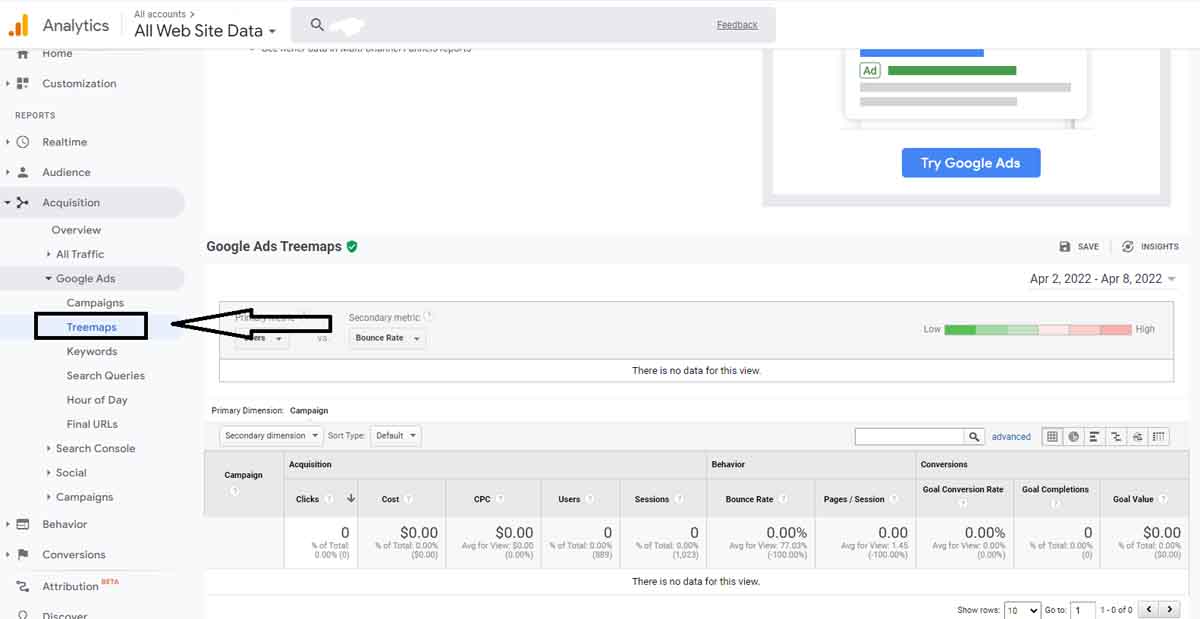
31. Explain Treemaps Report in Google Analytics?
The treemap display allows the user to highlight the data set’s most significant influence. One of the benefits of treemap visualization is the ease with which it may present correlated displays. It has simplified reporting—many different types of reports controlled with GA.
Google Analytics> Acquisition> Google Ads> Treemaps
You May also Like:- Secret of Writing SEO-friendly Article: Expert’s Techniques
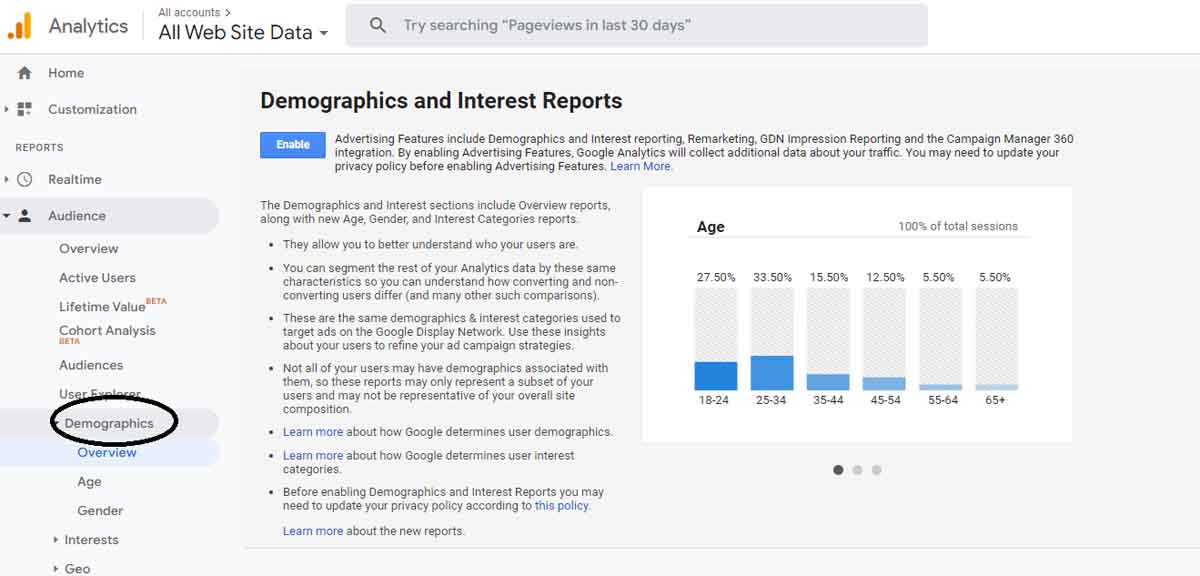
32. Explain demographics report in Google Analytics?
Google Analytics Demographics provides information on the age and gender of website users and the interests they express via their online travel and shopping activities. It may be seen in Google Analytics ‘Audience Report.’
33. How can one identify the keywords sending traffic to your website?
You can identify which keyword is sending more traffic to your website.
You can do this by –
Connect Google Search Console to Google Analytics.
Google Analytics > Acquisition > Search Console > Queries. The data for keywords, impressions, clicks, click-through rate, etc. will be displayed
Google Analytics > Acquisition > Search Console > Landing Pages report and then click on any of of your URLs to see what users are searching on Google to find the page.
34. What is RPC?
RPC, which stands for Revenue Per Click, is an e-commerce statistic seen in Google Analytics. This states the value of each click. You may use RPC to find the keywords that are affecting your campaign.
RPC= Goal Value x Conversion Rate.
You May also Like:- 21 Best Zero Investment Business Ideas (Highly Profitable)
35. How do you Calculate ROI in Google Analytics?
ROI means Return on Investments.
How to calculate ROI: (Revenue – Cost) / Cost.
36. Define Organization, Property, Views and Account in Google Analytics?
Property:- A website, mobile app, or device is an example of a property. Multiple properties can be assigned to an account. When we add a property to an account, the code we can use to get data from the property is generated. The code includes a one-of-a-kind ID that identifies the data from that property.
Views:- Views are a collection of filters and parameters that may be customized for individual reports. You may alter the data settings to reveal only relevant data and hide all irrelevant data.
Organization:- An organization refers to a corporation, and you can manage many accounts for various businesses.
Account:- Analytics is accessed using an account. To access analytics, you must have at least one account. Depending on your needs, you may specify the link between accounts and properties.
37. What are the most important things in Google Analytics you will want to analyze?
I want to analyze some Most Important Information:-
- Traffic Sources
- Number of Sessions
- Top-performing Pages
- Goal Conversion
- Exit Rate
- Bounce Rate
- Funnel
38. What is the Difference between clicks and users?
clicks mean how many times your users clicked on your website listing. The user’s column shows the number of unique users who clicked on your listing.
The following Reasons why these figures do not match:-
- A user may click on your listing several times.
- A user may click on the listing but close the page before it fully loads.
- On the landing page, there is no tracking code.
- Multiple visits with a single click
You May also Like:- Convesio: Best WordPress Hosting (Budget-Friendly)
39. What is the difference between Clicks and Sessions?
clicks mean how many times your users clicked on your website listing and the session column shows how many users launched unique sessions.
There are various reasons why these do not match. The Major Reasons are:-
A user may click on your listing several times.
A user may click but then close the page before it fully loads.
40. How do you link search console and google analytics?
You must enable search console data sharing in settings before using search console reports. then:-
Click admin >> select the property
Click property settings
Under the search console section, select the reporting view & save.
41. Why is Track page View helpful?
Tracking page views helps in the registration of pageviews.
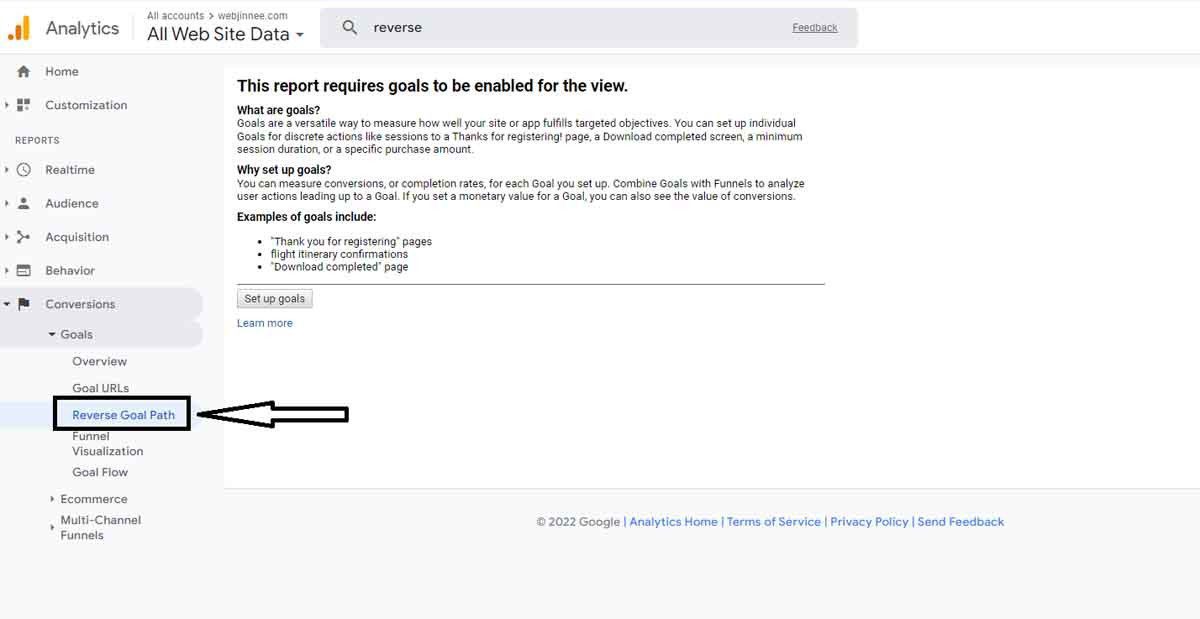
42. What is Reverse Goal Path Report?
The reverse goal route report retraces the visitor’s previous three steps in completing a goal.
The report helps the webmaster decide the number of conversions generated by each conversion path. It allows you to rewind the experience.
Google Analytics> Conversions> Goals> reverse Goal Path
You May also Like:- How to do Keyword Research for SEO
43. How to avoid spam in GA?
We can separate this information from spam sources.
44. Explain the use of Time lag report?
The time lag report helps us to evaluate the time difference between the initial session and the goal’s completion.
45. What is a category in Google Analytics?
A category is a term used to refer to a set of related events that you wish to analyse—for instance, profitable interaction, YouTube videos, and reading, among other things.
46. Explain Google Segments?
A segment is a subset of the data in your analytics. Like a piece of cake in your whole big cake of data
Segments assist you in separating and comprehending subsets of data to study business patterns.
Types of segments:
Users’ subsets
Session subsets
Subset of hits
47. Explain Multi-Channel Funnel Report?
You may use the multi-channel funnels report to determine how your marketing channels operate in concert to generate conversions. The report helps in showing the channel’s worth. With the help of a specific campaign, you may determine which factors contribute to conversions.
You May also Like:- 11 Most Popular Facebook Ads Management Tools
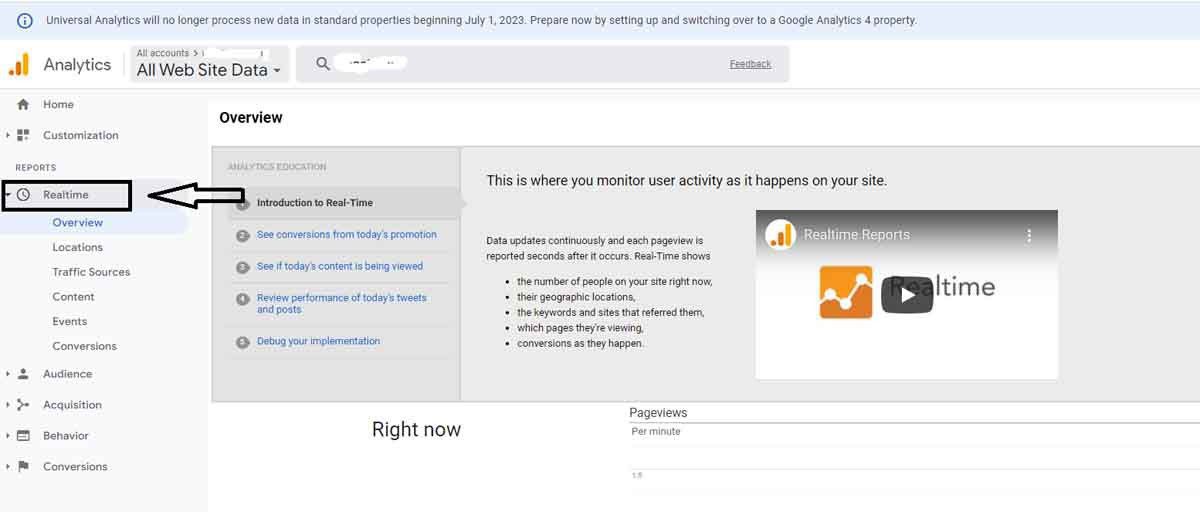
48. What is a ‘Real Time’ report in Google Analytics?
Real-time reports provide real-time data on traffic, insights, reactions, and sources. Reports are automatically updated, and hits are notified seconds after they occur.
Navigate to your view>> Open reports>> Real-time
49. What are Assisted conversions?
The assisted conversions tab in Google Analytics is used to evaluate the indirect value of a marketing channel, a UTM-encoded element, or a tracking landing page. In marketing, “assisted conversion” is when you look at how many interactions happen before the last click that leads to a conversion.
We can determine the channel values that aid in the initial mid-level cycle with assisted conversion. Put another way, this allows businesses to stop not looking at ways that lead clients to the ultimate marketing channel, which converts them.
50. What is Remarketing Audience in google analytics?
Remarketing audiences are required for Google Ads remarketing campaigns. Users who visited your website but did not convert can become part of your audience. After you’ve compiled the list, you can begin targeting those audiences with special offers and kicking off your remarketing campaign.
You May also Like:- Search Engine Optimization Interview Questions and Answers
51. Explain UTM Parameters?
Urchin Tracking Module is an abbreviation for Urchin Tracking Module. URLs with UTM parameters measure organic traffic, referral traffic, and CPC (Cost Per Click) traffic.
The UTM is attached to your website URL to make it unique and enable tracking the actual source of your website traffic easier.
Some UTM Parameters are:-
utm_source (Campaign Source)
utm_medium (Campaign Medium)
utm_content ( Campaign Content) [Optional Parameter]
utm_campaign (Campaign Name)
utm_term (Campaign Keyword) [Optional Parameter]
52. Explain custom events and how is it implemented?
Custom Events are an advanced URL parameter that may be added to your landing page URLs.
The following are the steps to creating custom Events:
Select an analytics level
Set your parameters – There are two aspects to custom parameters (Name and Value)
In the Custom parameter area, provide a custom parameter.
Fill up the Tracking template box with your parameter.
53. How many Types of Reports in Google Analytics?
Some Google Analytics Reports are:-
- Traffic acquisition report
- Bounce rate vs Exit rate report
- Mobile performance report
- New vs Returning visitors
- Keyword analysis report
- Content efficiency report
- Landing pages report
You May also Like:- How to Create a Custom Facebook Business Page URL
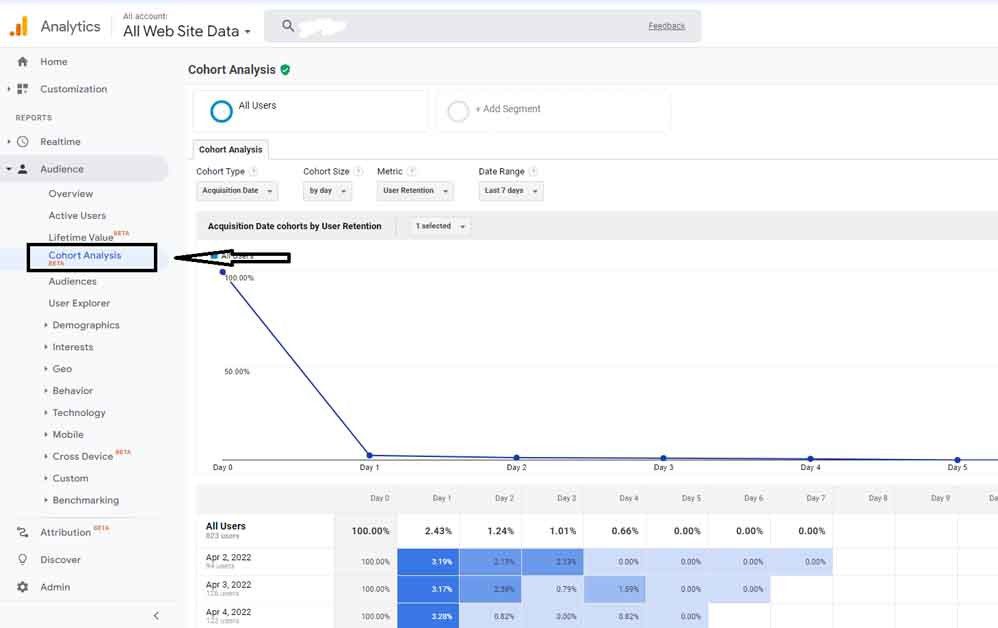
54. Explain Cohort in Google Analytics?
A cohort is a group of users who share at least one characteristic. Google Analytics’ cohort analysis helps you analyze cohort behavior over time.
Cohort includes four sections-
- Cohort type
- Cohort size
- Metric
- Date range
Google Analytics> Audience> Cohort Analysis
55. Explain Attribution Model?
The rule, or collection of rules, that defines how credit for sales and conversions is assigned to touchpoints in conversion pathways is known as an attribution model. It may be configured according to your marketing plan and user behavior.
56. What are all the popular Default Attribution Models?
The Popular Default Attribution Models are:-
- Time Decay
- Last Interaction
- First Interaction
- Linear
- Last Non-Direct Click
- Last Google Ads Click
- Position Based
57. Why is Google Analytics Important For Websites?
The importance of Google Analytics is:-
- Google Analytics is free
- It is used for tracking website traffic data and collecting visitor insight
- Provide real-time website traffic insight
- Generate customized reports
- It Can integrate with other tools and platforms
58. Is Google Analytics Useful for Small Businesses?
Google Analytics provides a wealth of information such as traffic sources, tracking your company’s objectives, discovering flourishing search phrases, bounce rate, traffic sources, etc. This lets small businesses improve their digital media marketing strategies and boost their marketing ROI.
59. What is Flat Table?
This is a relatively popular report that comprises, as the title suggests, a sortable data table in rows.
60. How To Set Up Install Tracking For Mobile Apps?
Step 1: Enable app install tracking for Android and iOS in your account.
Step 2: Update your Android and iOS Analytics SDKs.
For a complete list of procedures, go to ->> Set up install tracking for mobile applications.
You May also Like:- 9 Best Laptops for Blogging (Affordable Price)
61. Explain Not Provided Data in GA?
The keywords data that Google has banned will not appear in Analytics reports. The majority of websites cannot identify the particular terms for which a conversion occurred.

